Hi,
I'm seeing an issue when trying to apply MEAN and STDEV in a visualizer chart in Birst.
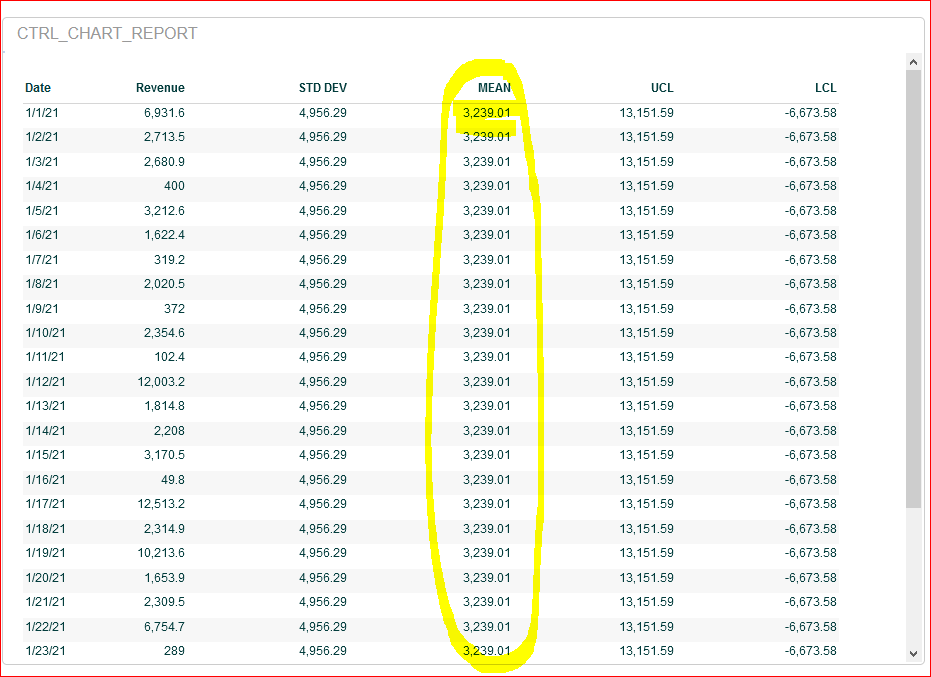
I'm using the following BQL to calculate the MEAN but somehow Birst is showing the wrong MEAN value
stat(avg,1,SELECT [Time.Date] ,[OrderDate: Revenue] FROM [ALL])
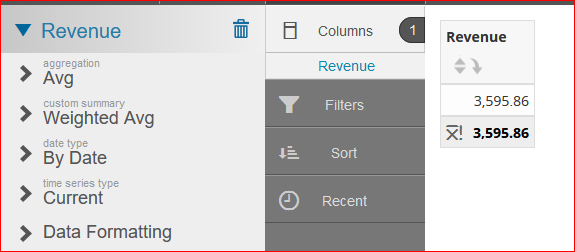
For the set of data I have I know the MEAN is 3595.96 and when I pull the measure and choose Avg as the aggregation I get the same value which is correct but when I try to use the above BQL to add MEAN to a chart or even to table Birst shows a different MEAN 3,239.01
Same issue is happening with STDEV.
Any idea why Birst is not showing the correct MEAN when using the BQL stat(avg,1,SELECT [Time.Date] ,[OrderDate: Revenue] FROM [ALL]) ?
And if this BQL statement is wrong what is the correct statement ?
Thank you
