I'm in the thick of trying to find a bug in Infor's accounting code. While working on this, I figured out how you can use Microsoft Visual Studio to step through T-SQL/SP to see line-by-line what is happening in the code. Microsoft had this functionality in SSMS v17, but removed it in v18. This also requires that your CSI/SQL Server be on premise and not in the cloud.
*shakes fist at the cloud*
NOTE: The account you are using to log into SQL Server *must* have 'sysadmin' rights or this will not work.
This is what you need to do:
- Install Visual Studio 2017,2019 or later. Community Edition should be fine. When installing make sure that the SQL Data Tools are installed. (I'm using Visual Studio 2019)
- Launch Visual Studio. You will not need to create a project, so continue into Visual Studio.
- On the left hand side, click "SQL Server Object Explorer" and the tool bar should appear.
- Click the button for "Add Server", fill in the information for your SQL Server & click connect.
- Once connected, use the explorer to navigate to your database -> Programmability -> Stored Procedures. It might take a little for the SP list to load.
- Navigate to the Stored Procedure you need to debug, right click & select "Debug Procedure".
- You will be prompted to enter all parameters. No need to add quotes, VS will take care of that. Once you click OK, the debugger will start.
- DO NOT START DEBUGGING YET. Press the square "Stop" button.
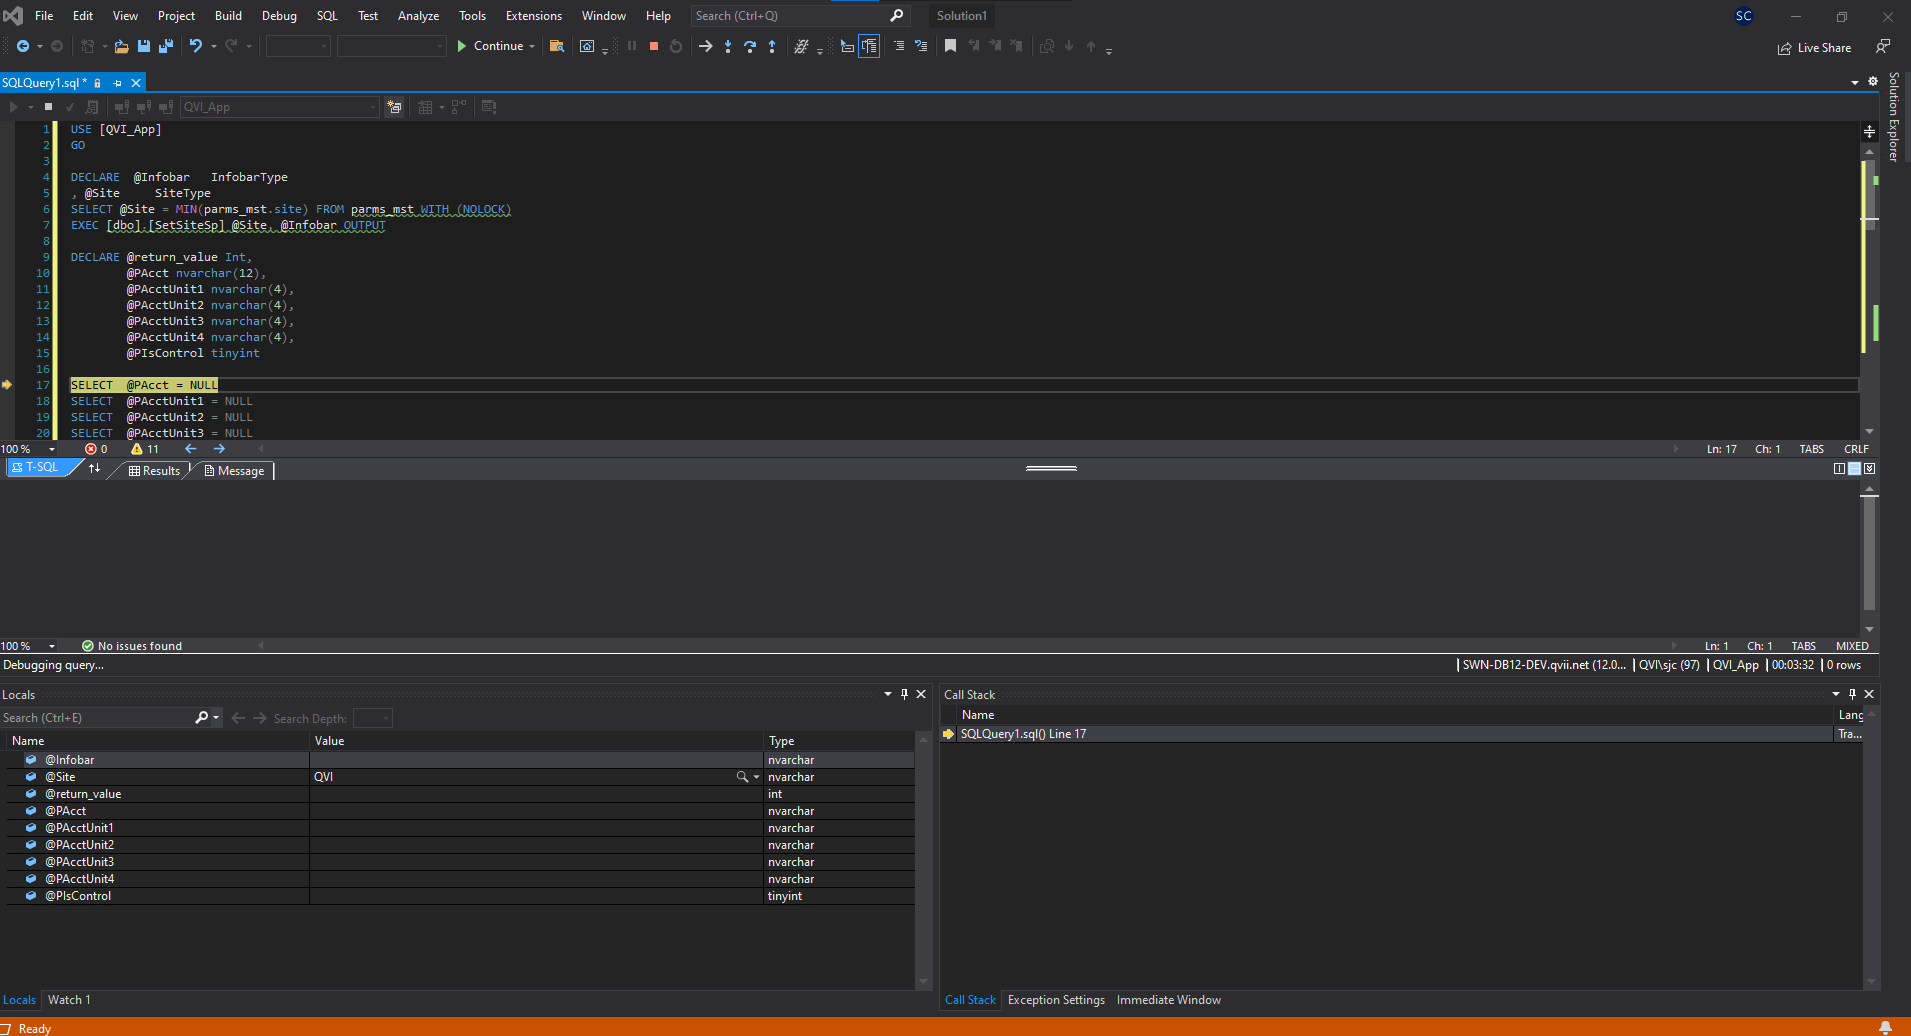
- After the "USE ... GO" lines, past in the Infor "magic code":
DECLARE @Infobar InfobarType
, @Site SiteType
SELECT @Site = MIN(parms_mst.site) FROM parms_mst WITH (NOLOCK)
EXEC [dbo].[SetSiteSp] @Site, @Infobar OUTPUT
- With the 'magic code' in place, either press ALT-F5 or press the small "down arrow" next to the green "Execute" arrow and choose "Execute with debugger".
- You should now see a yellow arrow to the left of your SQL code. This is the current line being executed. You should see 3 blue-ish buttons in the menu bar (down arrow, curved arrow, up arrow). To navigate:
- down arrow/F11 - Step Into - This tells the debugger if the current line is a function call/SP/etc, continue debugging INSIDE it.
- curved arrow/F10 - Step over - This tells the debugger to execute the current line, but not jump into a function/SP/etc. Simply execute and go to the next line.
- up arrow/Shift+F11 - Step out - This tells the debugger "Hey, I'm in a function/SP/etc. Just finish executing all the current code and bring me back to the next line in my main code.
You can see local variables on the lower left, and add watches for other variables. You cannot currently view tables/temp tables AFAIK. I've attached an image of what the debugger looks like when its running:
I hope this can help other coders out there!
