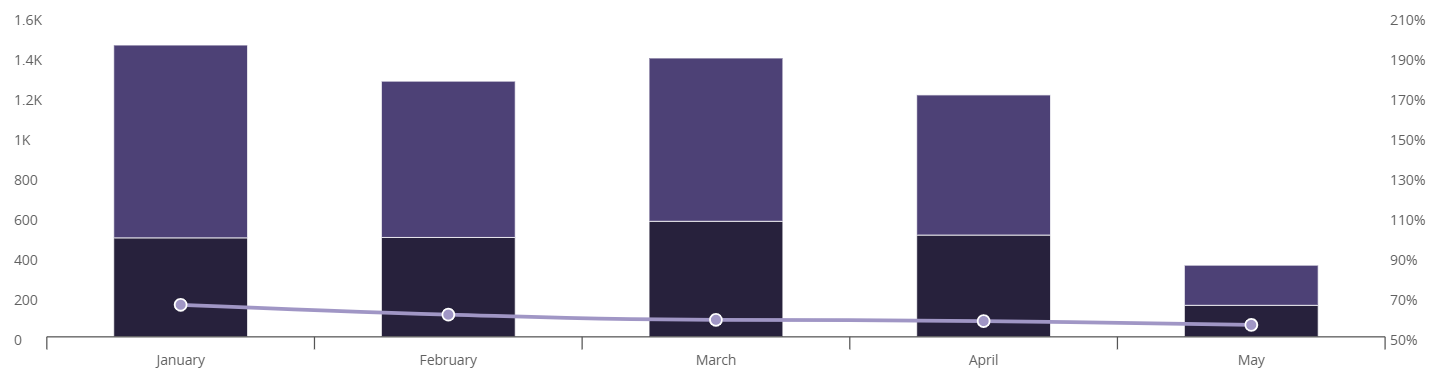
I'm building a chart that has 2 axis, one is # of purchase orders, one is % on time delivery. My OTD % axis is scaling ridiculously (50 - 210%) when the values in the chart are well within the 50-70 range. The chart looks ridiculous now, and I'm trying to figure out a way to get a normally scaled axis, whether that's the range where the data actually lives in, or even a 0-100. I can't do it manually, because if I do, I can't do the other axis automatically, and the # of purchase orders needs to be automatic. Any advice for how to deal with this issue? Thanks