Hello
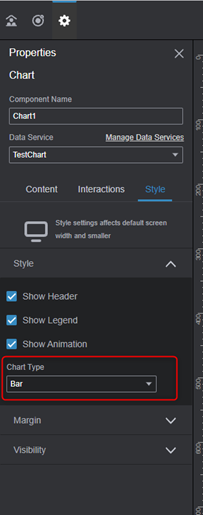
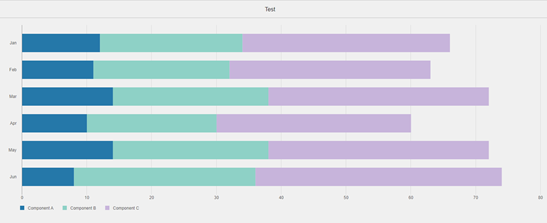
Does anyone have an example of how a dataset should look like when using this type of chart in the app-builder?
I tried making a dataset like the one used for the IDS chart components but I am not sure if they work the same.
var dataset = [{ data: [{ name: 'Category A', value: 373 }, { name: 'Category B', value: 372 }, { name: 'Category C', value: 236.35 }] }]
Is there any documentation on this type type of thing?